
Traders Dynamic Index Indicator (TDI) for MT4, MT5, cTrader – Precision Trading Tool
Stop cluttering your charts with multiple indicators. The Traders Dynamic Index Indicator MT4/MT5 is a single, powerful tool designed to give you a complete market assessment at a glance.
Developed by Dean Malone for professional traders, this comprehensive indicator intelligently merges the power of three core technical tools—the Relative Strength Index (RSI), Moving Averages, and Volatility Bands (similar to Bollinger Bands)—into one dynamic visual. Get clear, confirmed entry and exit signals, whether you’re a scalper or a swing trader.
Traders Dynamic Index Indicator MT4
Why Choose the MeetAlgo Traders Dynamic Index?
This is the ultimate version of the Traders Dynamic Index Indicator tailored for serious traders:
- ✅ Full MT4 & MT5 Compatibility: Seamlessly integrates with both terminals. Get the definitive Traders Dynamic Index MT4 and MT5 experience.
- 🎯 All-Market Coverage: Determines trend direction, momentum, and volatility simultaneously, eliminating the need for multiple screens.
- 🔔 Advanced Signal Alerts: Never miss a setup with integrated Pop-Up, Email, and Push Notifications.
- 📈 Adaptable Strategy: Works perfectly with any trading style (scalping, short-term, or medium-term), interpreting signals in accordance with your specific traders dynamic index strategy.
- 100% Non-Repainting: Guaranteed reliable signals on every timeframe.
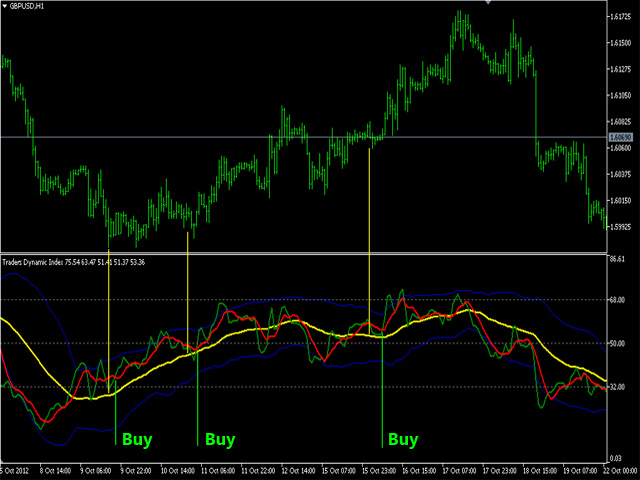
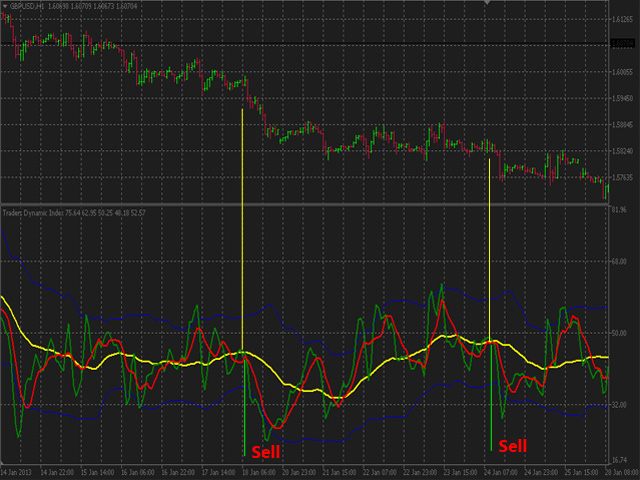
Mastering the Traders Dynamic Index Strategy & Signals
The true value of the TDI lies in its simple, color-coded logic. Use this powerful traders dynamic index strategy for high-probability market entries:
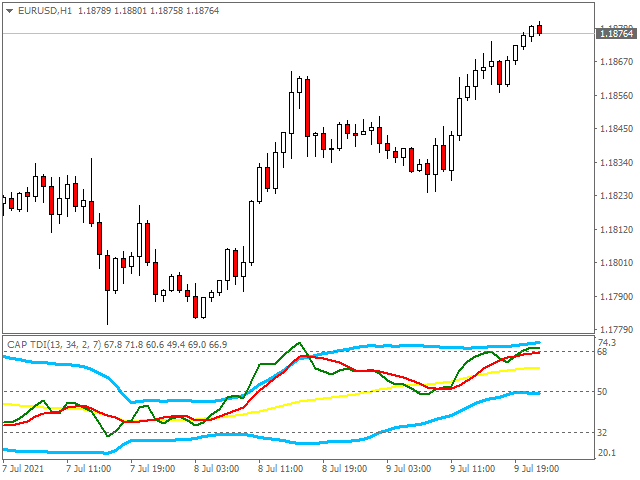
TDI Color Lines Explained (The Market’s State)
| Line | Description | Market Insight |
| Dark Blue Lines | Volatility Bands | Shows the strength of the current trend/volatility. |
| Yellow Line | Market Base Line (MBL) | Displays the longer-term direction of the trend. |
| Red Line | Slower Moving Average | Helps confirm the overall direction. |
| Green Line | Faster Moving Average (RSI Price Line) | Displays the market’s momentum and speed. |
High-Probability Entry Rules (The Crossovers)
| Action | Signal Condition |
| 💰 WHEN TO BUY | 1. Green line is above red line. 2. Both Green and Red lines are above the Yellow line. 3. Optional for Long-Term: Yellow line is above 50. |
| 🔴 WHEN TO SELL | 1. Red line is above Green line. 2. Both Red and Green lines are below the Yellow line. 3. Optional for Long-Term: Yellow line is below 50. |
| 🛑 AVOID TRADING | 1. Green/Red lines are outside or very near the Blue Line. 2. Blue Lines (bands) are too narrow (low volatility). |
Full Customization: Detailed TDI Indicator Settings
Gain full control over your analysis by adjusting the indicator’s core tdi indicator settings. We provide professional defaults, but you can fine-tune every parameter to match your asset and timeframe.
- Configurations
- RSI Period: 8-25 – RSI Period (Default 13);
- RSI Price – Applied Price for RSI (Default Close Price);
- Volatility Band: 20-40 – Volatility band (recommended values between 20-40) (Default 34);
- Standard Deviations: 1-3 –
- RSI Price Line – Period for RSI Price Line (Default 2)
- RSI Price Type – RSI Price Type.
- Trade Signal Line – Period for Trade Signal Line (Default 7)
- Notifications
- Signal Bar – Select which signal will show you. On current bar or after close trade bar.
- Enable Pop-Up Alerts – Show Pop alerts on the chart.
- Enable Email Alerts – Email alerts. For email, you have to configure the email setting on your terminal properly.
- Enable Push Alerts – Push alerts on your mobile. you have configured a push notification on your mobile to get alerts.
- Enable Sound Alerts – Enable sound alert.